The article contains an understanding of the Dynamic Time Warping(DTW) algorithm.
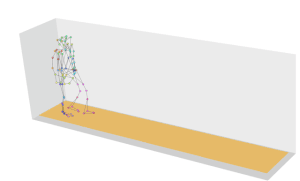
Two repetitions of a walking sequence were recorded using a motion-capture system. While there are differences in walking speed between repetitions, the spatial paths of limbs remain highly similar. Credits
Introduction
The phrase “dynamic time warping,” at first read, might evoke images of Marty McFly driving his DeLorean at 88 MPH in the Back to the Future series. Alas, dynamic time warping does not involve time travel; instead, it’s a technique used to dynamically compare time series data when the time indices between comparison data points do not sync up perfectly.
As we’ll explore below, one of the most salient uses of dynamic time warping is in speech recognition – determining whether one phrase matches another, even if the phrase is spoken faster or slower than its comparison. You can imagine that this comes in handy to identify the “wake words” used to activate your Google Home or Amazon Alexa device – even if your speech is slow because you haven’t yet had your daily cup(s) of coffee.
Dynamic Time Warping(DTW)
In time series analysis, Dynamic Time Warping (DTW) is one of the algorithms for measuring the similarity between two temporal time series sequences, which may vary in speed. The main idea of DTW is to compute the distance from the matching of similar elements between time series. It uses the dynamic programming technique to find the optimal temporal matching between elements of two-time series.
For instance, similarities in walking could be detected using DTW, even if one person was walking faster than the other, or if there were accelerations and decelerations during an observation. DTW has been applied to temporal sequences of video, audio, and graphics data — indeed, any data that can be turned into a linear sequence can be analyzed with DTW. A well-known application has been automatic speech recognition, to cope with different speaking speeds. Other applications include speaker recognition and online signature recognition. It can also be used in partial shape matching applications.

The objective of time series comparison methods is to produce a distance metric between two input time series. The similarity or dissimilarity of two-time series is typically calculated by converting the data into vectors and calculating the Euclidean distance between those points in vector space.
In general, DTW is a method that calculates an optimal match between two given sequences (e.g. time series) with certain restrictions and rules:
Every index from the first sequence must be matched with one or more indices from the other sequence and vice versa
The first index from the first sequence must be matched with the first index from the other sequence (but it does not have to be its only match)
The last index from the first sequence must be matched with the last index from the other sequence (but it does not have to be its only match)
The mapping of the indices from the first sequence to indices from the other sequence must be monotonically increasing, and vice versa, i.e. if j>i are indices from the first sequence, then there must not be two indices l>k in the other sequence, such that index i is matched with index l and index j is matched with index k, and vice versa.

Time normalized distance between Series A and B. Credits.
Understand DTW Mathematically
Let's assume we have two sequences like the following:

The sequences X and Y can be arranged to form an n-by-m grid, where each point (i, j) is the alignment between xi and yj.
A warping path W maps the elements of X and Y to minimize the distance between them. W is a sequence of grid points (i,j). We will see an example of the warping path later.
Warping Path and DTW distance
The Optimal path to (i_k, j_k) can be computed by:

where 𝑑 is the Euclidean distance. Then, the overall path cost can be calculated as:

Restrictions on the Warping function
The warping path is found using a dynamic programming approach to align two sequences. Going through all possible paths is “combinatorically explosive”. Therefore, for efficiency purposes, it’s important to limit the number of possible warping paths, and hence the following constraints are outlined:
Boundary Condition: This constraint ensures that the warping path begins with the start points of both signals and terminates with their endpoints.

Monotonicity condition: This constraint preserves the time-order of points (not going back in time).

Continuity (step size) condition: This constraint limits the path transitions to adjacent points in time (not jumping in time).

In addition to the above three constraints, there are other less frequent conditions for an allowable warping path:
Warping window condition: Allowable points can be restricted to fall within a given warping window of width 𝜔 (a positive integer).

Slope condition: The warping path can be constrained by restricting the slope, and consequently avoiding extreme movements in one direction.
An acceptable warping path has combinations of chess king moves that are:
Horizontal moves: (𝑖, 𝑗) → (𝑖, 𝑗+1)
Vertical moves: (𝑖, 𝑗) → (𝑖+1, 𝑗)
Diagonal moves: (𝑖, 𝑗) → (𝑖+1, 𝑗+1)
Why do we need DTW?
Any two-time series can be compared using Euclidean distance or other similar distances on a one-to-one basis on the time axis. The amplitude of the first time series at time T will be compared with the amplitude of the second time series at time T. This will result in a very poor comparison and similarity score even if the two-time series are very similar in shape but out of phase in time.

DTW compares the amplitude of the first signal at time T with the amplitude of the second signal at time T+1 and T-1 or T+2 and T-2. This makes sure it does not give a low similarity score for signals with similar shapes and different phases.
How DTW algorithm work?
Let us take two-time series signals A and B:


Step 1: Empty Cost Matrix Creation
Create an empty cost matrix M with x and y labels as amplitudes of the two series to be compared.

Step 2: Cost Calculation
Fill the cost matrix using the formula mentioned below starting from the left and bottom corners.
M(i, j) = |A(i) — B(j)| + min ( M(i-1,j-1), M(i, j-1), M(i-1,j) )
where,
M is the matrix
i is the iterator for series A
j is the iterator for series B
So in the below table, we have computed the cost of some values.

Let us take a few examples from the above table (6, 9, and 12 ) to illustrate the calculation as highlighted in the below table
For 6,

|8 –5| + min( 6, 6, 3 ) = 6
Similarly for 9,
|4 –1| + min( 6 ) = 9
And the same for 12,
|1 –5| + min( 8 ) = 12
The full table will look like this:

Step 3: Warping Path Identification
Identify the warping path starting from the top right corner of the matrix and traversing to the bottom left. The traversal path is identified based on the neighbor with a minimum value.
In our example, it starts with 17 and looks for the minimum value i.e. 12 among its neighbors 18, 14, and 12.


The next number in the warping traversal path is 9. This process continues till we reach the bottom of the left axis of the table.

The final path will look like this:

Let this warping path series be called as d.
d = [17, 12, 9, 9, 9, 7, 7, 6, 3, 2, 1, 0]
Step 4: Final Distance Calculation
Time normalized distance, D

where k is the length of the series d.
k = 12 in our case.
D = ( 17 + 12 + 9 + 9 + 9 +7 + 7 + 6 + 3 + 2 +1 + 0)/ 12
D = 6.8333
DTW implementation in Python
For implementation, we will use fastdtw python library.
FastDTW is an approximate Dynamic Time Warping (DTW) algorithm that provides optimal or near-optimal alignments with an O(N) time and memory complexity, in contrast to the O(N^2) requirement for the standard DTW algorithm.
Install the library:
pip install fastdtwImport all required libraries
import pandas as pd
import numpy as np

# Plotting Packages
import matplotlib.pyplot as plt
import seaborn as sbn

import matplotlib as mpl
mpl.rcParams['figure.dpi'] = 150
savefig_options = dict(format="png", dpi=150, bbox_inches="tight")

# Computation packages
from scipy.spatial.distance import euclidean
from fastdtw import fastdtw
Let’s define a method to compute the accumulated cost matrix D for the warp path. The cost matrix uses the Euclidean distance to calculate the distance between every two points. The methods to compute the Euclidean distance matrix and accumulated cost matrix are defined below:
def compute_euclidean_distance_matrix(x, y) -> np.array:
    """Calculate distance matrix
    This method calcualtes the pairwise Euclidean distance between two sequences.
    The sequences can have different lengths.
    """
    dist = np.zeros((len(y), len(x)))
    for i in range(len(y)):
        for j in range(len(x)):
            dist[i,j] = (x[j]-y[i])**2
    return dist
def compute_accumulated_cost_matrix(x, y) -> np.array:
"""Compute accumulated cost matrix for warp path using Euclidean distance
"""
distances = compute_euclidean_distance_matrix(x, y)
# Initialization
cost = np.zeros((len(y), len(x)))
cost[0,0] = distances[0,0]
for i in range(1, len(y)):
cost[i, 0] = distances[i, 0] + cost[i-1, 0]
for j in range(1, len(x)):
cost[0, j] = distances[0, j] + cost[0, j-1]
# Accumulated warp path cost
for i in range(1, len(y)):
for j in range(1, len(x)):
cost[i, j] = min(
cost[i-1, j], # insertion
cost[i, j-1], # deletion
cost[i-1, j-1] # match
) + distances[i, j]
return costNow, Create two sequences.
x = [7, 1, 2, 5, 9]
y = [1, 8, 0, 4, 4, 2, 0]
We cannot calculate the distance between x and y since they don’t have equal lengths.
fig, ax = plt.subplots(figsize=(6, 4))

# Remove the border and axes ticks
fig.patch.set_visible(False)
ax.axis('off')

xx = [(i, x[i]) for i in np.arange(0, len(x))]
yy = [(j, y[j]) for j in np.arange(0, len(y))]

for i, j in zip(xx, yy[:-2]):
    ax.plot([i[0], j[0]], [i[1], j[1]], '--k', linewidth=1)

ax.plot(x, '-ro', label='x', linewidth=1, markersize=20, markerfacecolor='lightcoral', markeredgecolor='lightcoral')
ax.plot(y, '-bo', label='y', linewidth=1, markersize=20, markerfacecolor='skyblue', markeredgecolor='skyblue')
ax.set_title("Euclidean Distance", fontsize=10, fontweight="bold")
Euclidean distance between x and y
Compute DTW distance and warp path
Many Python packages calculate the DTW by just providing the sequences and the type of distance (usually Euclidean by default). Here, we use a popular Python implementation of DTW that is FastDTW which is an approximate DTW algorithm with lower time and memory complexities.
dtw_distance, warp_path = fastdtw(x, y, dist=euclidean) Note that we are using SciPy‘s distance function Euclidean which we imported earlier. For a better understanding of the warp path, let’s first compute the accumulated cost matrix and then visualize the path on a grid. The following code will plot a heatmap of the accumulated cost matrix.
cost_matrix = compute_accumulated_cost_matrix(x, y)fig, ax = plt.subplots(figsize=(6, 4))
ax = sbn.heatmap(cost_matrix, annot=True, square=True, linewidths=0.1, cmap="YlGnBu", ax=ax)
ax.invert_yaxis()
# Get the warp path in x and y directions
path_x = [p[0] for p in warp_path]
path_y = [p[1] for p in warp_path]
# Align the path from the center of each cell
path_xx = [x+0.5 for x in path_x]
path_yy = [y+0.5 for y in path_y]
ax.plot(path_xx, path_yy, color='blue', linewidth=1, alpha=0.2)

The color bar shows the cost of each point in the grid. As can be seen, the warp path (blue line) is going through the lowest cost on the grid. Let’s see the DTW distance and the warping path by printing these two variables.
print("DTW distance: ", dtw_distance)
print("Warp path: ", warp_path)
DTW distance: 23.0
Warp path: [(0, 0), (0, 1), (1, 2), (2, 3), (3, 4), (3, 5), (4, 6)]
The warping path starts at point (0, 0) and ends at (4, 6) by 6 moves. Let’s also calculate the accumulated cost most using the functions we defined earlier and compare the values with the heatmap.
cost_matrix = compute_accumulated_cost_matrix(x, y)
print(np.flipud(cost_matrix)) 
The cost matrix printed above has similar values to the heatmap.
Now let’s plot the two sequences and connect the mapping points. The code to plot the DTW distance between x and y is given below.
fig, ax = plt.subplots(figsize=(6, 4))

# Remove the border and axes ticks
fig.patch.set_visible(False)
ax.axis('off')

for [map_x, map_y] in warp_path:
    ax.plot([map_x, map_y], [x[map_x], y[map_y]], '--k', linewidth=1)

ax.plot(x, '-ro', label='x', linewidth=1, markersize=20, markerfacecolor='lightcoral', markeredgecolor='lightcoral')
ax.plot(y, '-bo', label='y', linewidth=1, markersize=20, markerfacecolor='skyblue', markeredgecolor='skyblue')

ax.set_title("DTW Distance", fontsize=10, fontweight="bold")

DTW distance between x and y
You can download the code from Github.
Applications of DTW
1. To detect similarities in walking. If one person was walking faster than the other, or if there were accelerations and decelerations during an observation.
2. Spoken word recognition applications. They are used to match a sample voice command with others' commands even if the person talks faster or slower than the prerecorded sample voice.
3. Correlation power analysis
Originally published in KDnuggets.